
webshop
Bookinger
Begivenheder
Popup

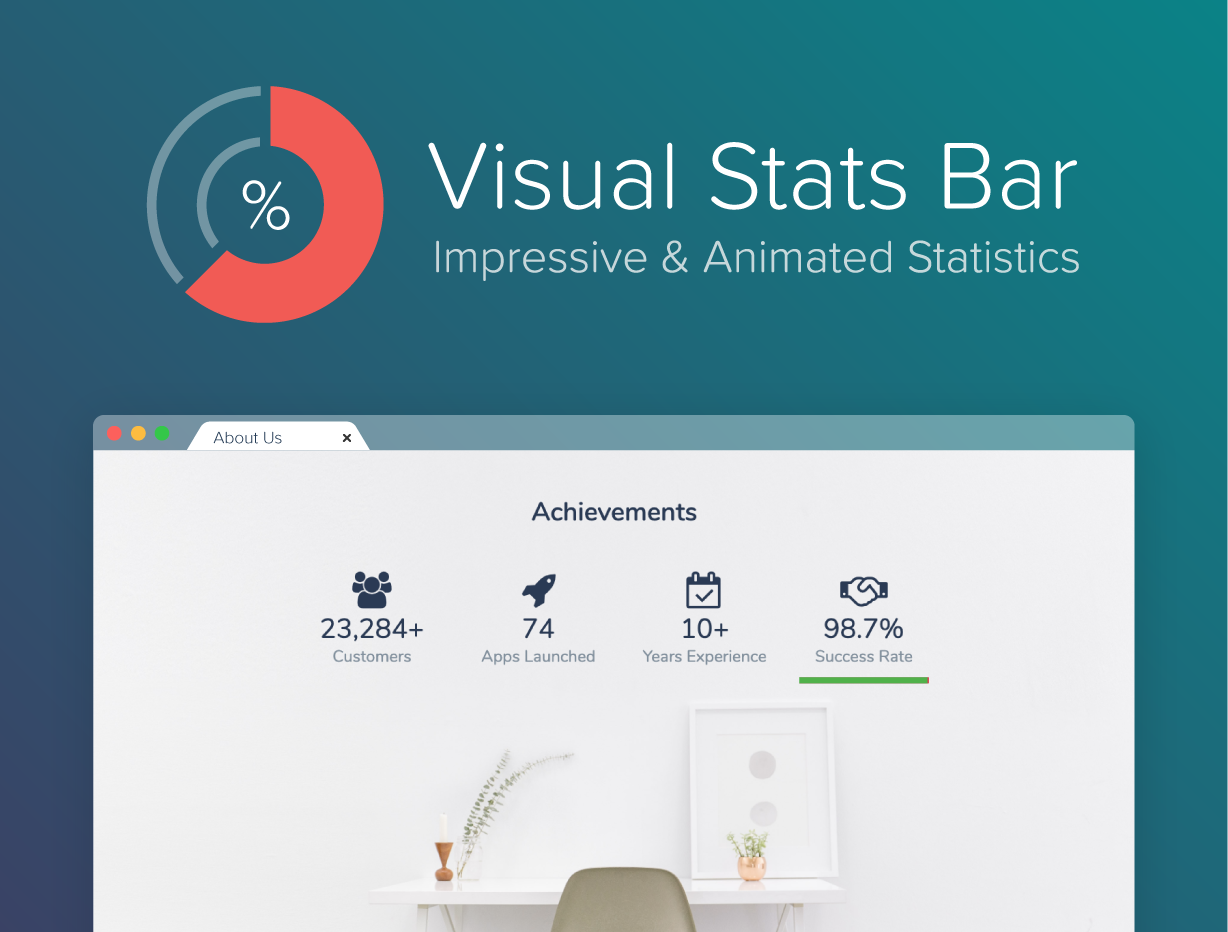
Visual Stats Bar
Fra
Show stats & achievements with animated graphs
1.7
Gratis abonnement er tilgængeligt


Visual Stats Bar-oversigt
- Smooth number & graph animations
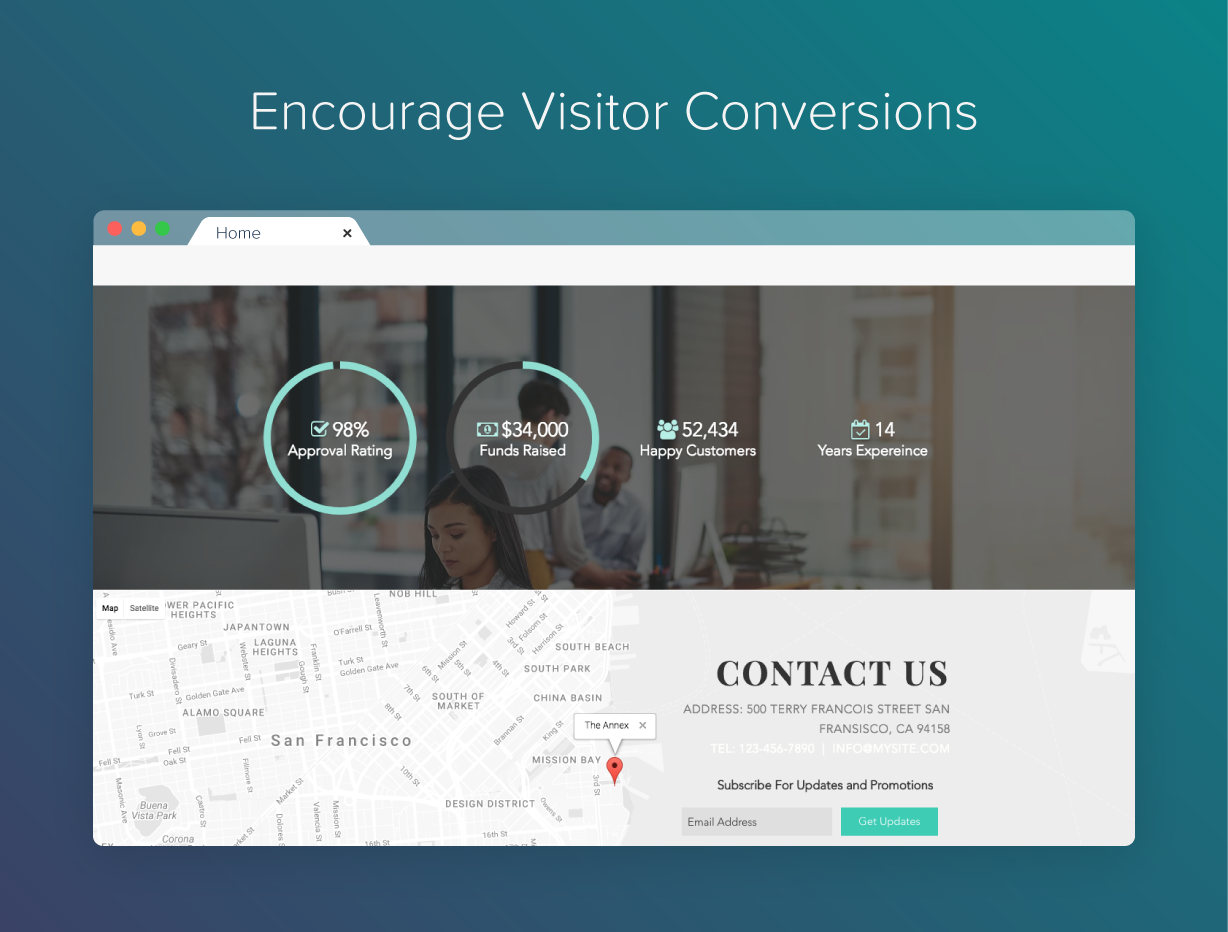
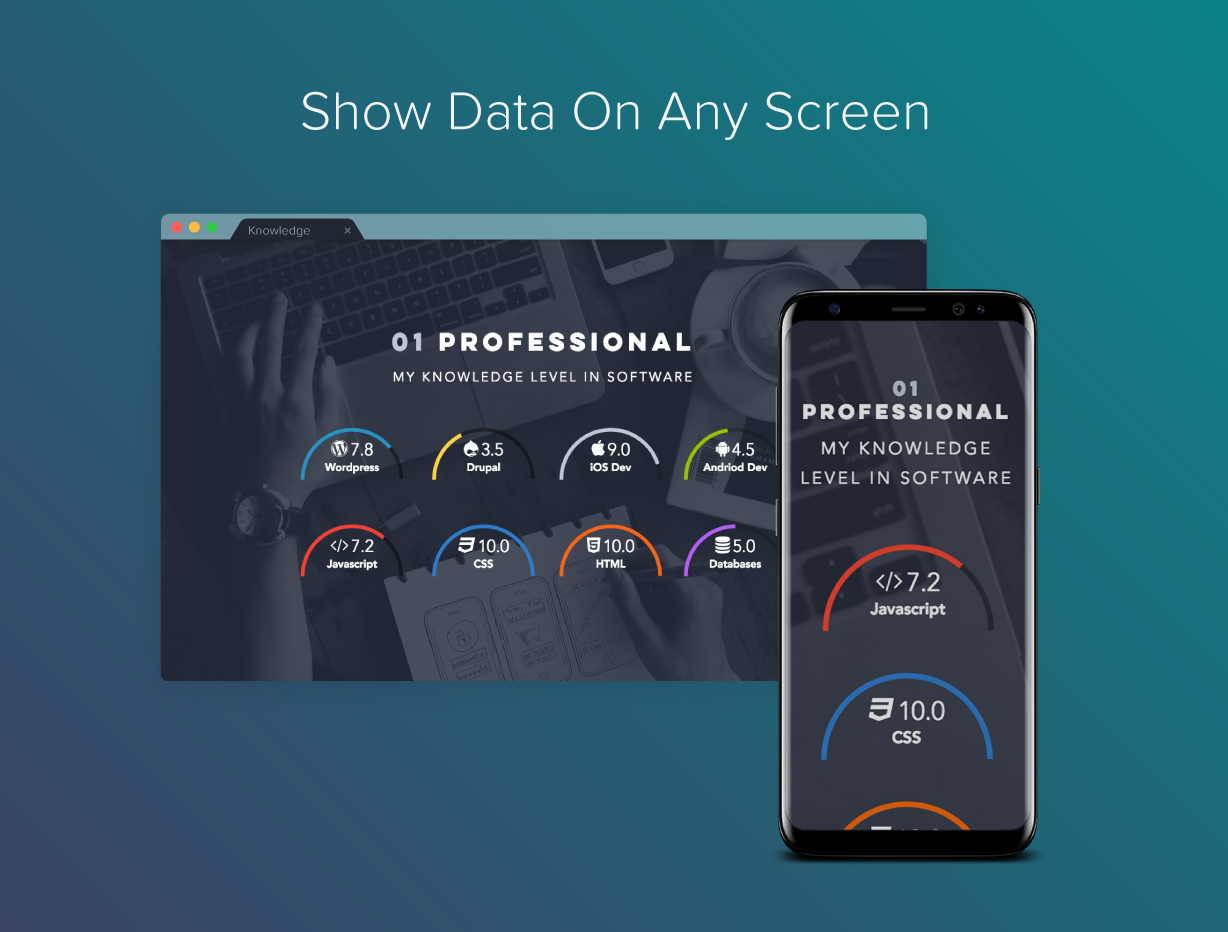
- Choose from 7 customizable layouts
- Connect with Collections or Google Sheets to show live data
- Easy Setup
Kategorier
Tilgængelig:
Denne app er tilgængelig over hele verden.App-sprog:
Engelsk
PT
App udviklet afPaper Temple
Besøg vores hjemmesideKontakt os for supportPrivatlivspolitik
Spry Solutions Inc sikrer, at de overholder EU's handelslovgivning. Mere info
1.7 gennemsnitlig bedømmelse
16 bedømmelser
5
2
4
1
3
2
2
0
1
11
Sorter efter:
JE
Jerm180/ Feb 1, 2026
Doesn't work with CMSUnable to use with cms
(0)
Tak for din feedback
LA
Lauralambent2/ Dec 2, 2025
Doesn't work without subscriptionIn the free option the values are wiped when you publish. It looks okay in the editor, but the published version is always zero.
(0)
Tak for din feedback
JA
Jameshewitt18/ May 16, 2025
Doesnt workAs soon as I change the text/title, the bar visual won't load past 1%. Nor does it show the text
PA
team Paper Temple
We should be able to help, please feel free to contact us via the contact tab in the widget settings panel. The most common reason that this can happen is when the starting...(0)
Tak for din feedback
ZW
Zwagera/ Mar 4, 2025
Impossible to publish without upgrade. Tried a hundred times to publish, without any fancy thing. But app keeps saying I need to upgrade. Shame on the developers
PA
team Paper Temple
Hello, the widget should still publish without upgrading. Only the premium features are disabled when published. There may be some other things going on that we should be able to help with. Please...(0)
Tak for din feedback
DB
Dbjstudio/ Feb 28, 2025
fantastic applove it - no issues at all.
PA
team Paper Temple
Thanks for taking the time to leave us a review. It means a lot to our team, especially since most reviews tend to come from those facing challenges. Your feedback motivates us to...(0)
Tak for din feedback
Priser og betalingspakker
Basic-abonnement
Gratis
3 Layout Options
Animated Progress Bar
Definable Start, Goal & Current Value
Premium-abonnement
$
2
40
/måned
4 Additional Layout Options
Connect to Collections & Google Sheets
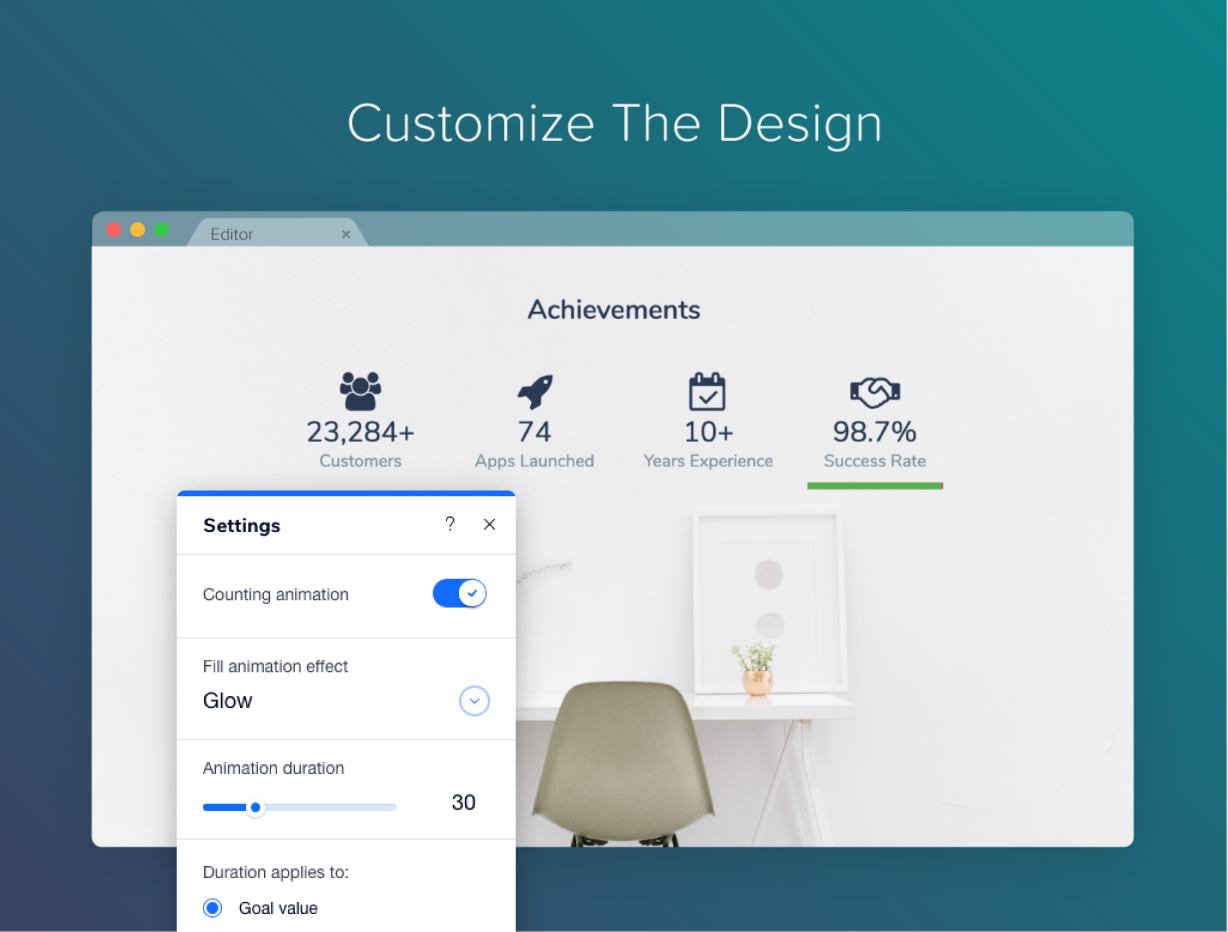
Enable Number Counting Animation
Set Animation Duration
* Prisen er i USD.